Making better marketing decisions is made easier with the help of Google Analytics 4, an effective marketing tool for insights. What you should know about GA4 is provided here.
Google made the biggest update to Google Analytics ever in October: Google Analytics 4. With major improvements, there is a lot to understand, and it’s only reasonable to question how this may impact your career or business.
New properties now default to GA4, even though there is no sign that classic GA will disappear very soon. This indicates that understanding Google Analytics 4 should be prioritized.
1. What Is Google Analytics 4?
The most recent version of Google Analytics is called Google Analytics 4. With this brand-new generation of web analytics, marketers can more thoroughly examine crucial client usage indicators than only measure traffic.
Google Analytics 4 uses AI and machine learning to deliver more in-depth insights into how customers engage with your website and app while tracking the complete customer journey across various platforms.
GA4 emphasizes consumer privacy as well. This contradicts several current privacy rules, including GDPR and CCPA. Innovative technology GA4 provides superior insights with tracking that prioritizes privacy, cross-channel data measurement, and AI-powered predictive analytics.
2. Difference Between Universal Analytics & Google Analytics 4
Google Analytics 4 (GA4) allows you to report on activity on both websites and applications, which is the most noticeable distinction between GA4 and Universal Analytics. Other distinctions include the following:
2.1. A New Dashboard Is Available for Google Analytics 4
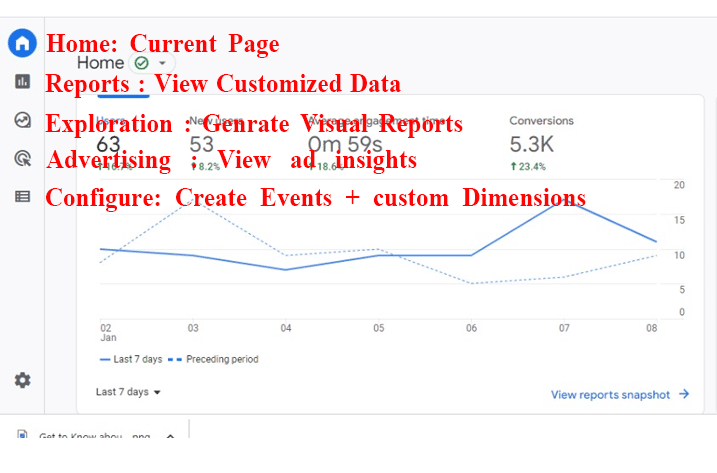
You’re likely to notice the completely redesigned dashboard as the first update. Many reports you are used to seeing are gone or moved, and everything is better organized. The home, reports, explore, advertising, configure, and library buttons are located in the navigation bar to the right.
Keep reading because I’ll go into more detail about the features and what they signify in a later part. At the bottom, under Insights, you’ll get predicted insights based on Google’s AI.
2.2. In GA4, Every Measurement Is An Event.
Page views were the key statistic with Universal Analytics. All measures are events using Google Analytics 4. You may now get a more comprehensive insight into how users engage with your app and website rather than just seeing broad statistics.
How does this affect you? Although you may still examine session-level reporting, being able to segment it by interaction results in more insightful reports and data.
There are several new metrics in GA4. These include measurements for engagement like:
- Engaged Sessions
- Engagement Rate
- Engagement Time
Other aspects that are tracked by it include attribution, demographics, events, and so on. Although this is a significant change, it will simplify following clients as they travel. Page views were once thought to be the most significant measure by GA.
However, that is no longer the case. Although there may be a learning curve for the additional parameters, you will have access to more data.
2.3. Utilize Google Analytics 4 to Access Predictive Insights
While looking at previous activities may help you comprehend your audience better, you won’t be able to take preventative action by doing so. You may make broad, data-driven choices using GA4’s predictive metrics.
How does this appear? Predictive analytics may have a substantial influence on retargeting strategies for the majority of firms. AI metrics consist of the following:
- Purchase Probability
- Churn Probability
- Revenue Prediction
You may develop audiences based on their anticipated behaviors using the abovementioned data. For instance, users are likely to spend more than $500 on a single transaction, or they are likely to purchase within the next week.
Then, these audiences may be targeted using social media or Google Ads campaigns. The performance of websites can be enhanced using these indicators.
You may design unique funnels for various audiences based on their habits and requirements. As more information is gathered, the recommendations will keep becoming better.
2.4. GA4 Provides More Control to Marketers
You may personalize the dashboard in GA4 so you can view the most important reports to your company. It even integrates nicely with Google Data Studio so that you can design unique visualizations of the gathered data.
You may also build custom segments on trigger events, simply a subset of events on your website or application. You can track client interactions more precisely as a result of this.
You may, for instance, establish segments based on all conversion events in a specific area. Thanks to these features, you can now observe your users and their habits at a more detailed level.
2.5. Platform-to-Platform Tracking
What transpires when people use several platforms? Tracking users across platforms was practically impossible with the outdated Google Analytics. The beta moniker of Google Analytics App + Web refers to the new Google Analytics 4’s ability to track web and app data in one property.
You can observe the customer experience through cross-platform tracking, including customer acquisition, engagement, monetization, and retention. The user experience may be tracked with GA4 from beginning to end across various platforms.
Unique user IDs issued upon app or website login are used for this. The user ID for each logged-in session will be delivered from the website or the application to Google Analytics with the proper gtag.js script.
Any user metrics will be recorded, and the ID will be transmitted to the GA4 property. The reports will link the user’s data to their unique ID and continue where they left off when the user checks in again on a different platform.
For any marketer, knowing this information can help you understand your users’ cross-platform experiences far better. Additionally, the data may be used to extrapolate for a broad population and create more precise consumer models.
3. Do I Need To Upgrade To Google Analytics 4?
Is it urgent for you to upgrade to Google Analytics 4?
In a word, yes.
Create a GA4 property and set it up to work alongside Universal Analytics. Even if you don’t intend to use it right now, gathering data and improving your machine learning (ML) models will improve the significance of your future study.
4. How to Setup Google Analytics 4
There are two different setup procedures for Google Analytics 4 because it may be used for your website or application (or both). The list of them is below.
4.1. Alongside an Existing Property
The GA4 Setup Assistant may be used to set up a Google Analytics 4 property if your website already has a Universal Analytics property.
1. Click “Admin” in the lower left corner of Google Analytics.
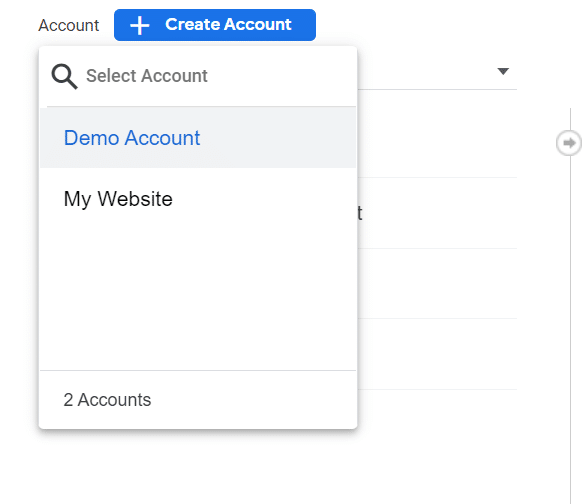
2. Choose the desired account from the Account column:
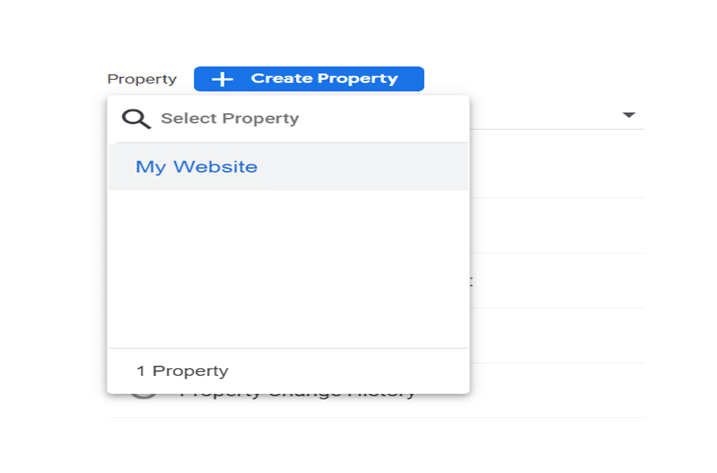
3. Choose the Universal Analytics property that presently gathers data for your website from the Property column:
4. Choose GA4 Setup Assistant from the Property column:

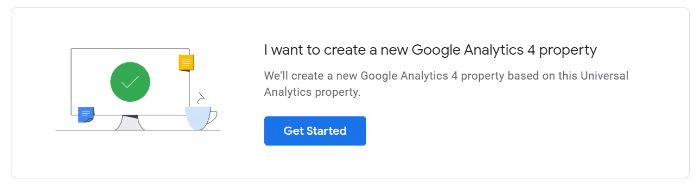
5. I want to establish a new Google Analytics 4 property, so click “Get started.”
6. You can pick “Enable data collection using your existing tags” if your website employs the gtag.js tag.
7. Simply select “Create Property.”
There are three reasons why you might not be able to “Enable data collection using your existing tags”:

Your website builder/CMS does not currently support the gtag.js tag.
- Google Tag Manager is employed.
- js is installed on your website.
- You’ll have to add the tag in each of the three scenarios.
4.2. For Firebase, Google Analytics
Follow these procedures to update your Firebase account to Google Analytics 4:
- Open the Firebase interface and log in.
- On the left side, select Analytics > Dashboard.
- At the top of the page, in the banner, click “Begin upgrading.”
- To finish the upgrade, adhere to the instructions displayed on the screen.
Once updated, app analytics are available in Google Analytics and the Firebase interface.
5. How Can I Use Google Analytics 4.
I’ll guide you through using the new Google Analytics platform now that you know its potential. I’ll admit that the platform has a learning curve, which can be annoying.
To begin, adhere to the instructions below. You will learn the fundamentals and how to use the new platform from here. Consider enrolling in a longer-form course or getting in touch with my staff for extra assistance if you still aren’t getting the required facts.
5.1. Experience The New Search Bar
More than ever, GA4’s search function gives you immediate answers to specific questions (such as “how many people this month vs. previous year”), access to certain reports or insights, property configuration, or the help content.
To explore what is available, try a few searches like “how to make a report” or “top users by city.” The search board will be quite helpful as you become familiar with the new interface.
5.2. Understand The New Dashboard
Let’s now see the updated dashboard. It could appear rather similar at first sight. However, if you glance around, you’ll see that the majority of the reports you’re familiar with are not there where they formerly were.
Here is the dashboard with annotations. Both the left navigation bar and the various displays include labels. Since I’m using the GA sample account for this walkthrough (which you can access here), your version could look slightly different from mine, particularly if you’ve already begun customizing it.
5.3. Look Around The Reports Dashboard
From the dashboard, select the graph-shaped icon that is the second item on the left navigation bar.
You will then be sent to the reports dashboard, which displays summaries of several reports. This tab contains most of the reports you are used to reading, albeit they could seem somewhat different.
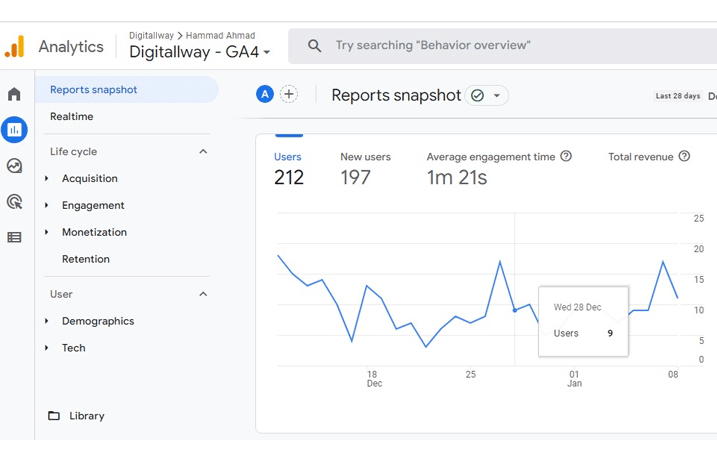
Numerous data points are present. I won’t go over it all because different websites track various stats, so yours may differ.
However, suppose you want to know how many individuals visited a certain page. You would click “engagement” on this dashboard, then look at the chart labeled “Views by page title and screen class.”
5.4. Personalize Your Reports Quick View
Customizing the report snapshot so you can quickly view the info that matters to you is one of my favorite features. You will also better understand GA4, making it easier for you to operate.
Let’s start by making a new report.
Start by selecting Library from the left navigation bar’s bottom. You don’t have admin access if you can’t see this option since it’s unavailable in the demo account.
Then select Create a new report after descending to the Reports table. Select Create an Overview Report after that. GA will assist you through the report creation in exchange for the data source.
Click the six does drag indication to modify the arrangement of your overview. You may drag and drop the cards with this. The X symbol can be clicked to delete cards. Select + Add Cards if you wish to add new cards.
5.5. Establish A New Event
The new Google Analytics relies heavily on events; this is how you’ll monitor almost everything. If you don’t see the alternatives I mentioned, it could be because you don’t have an editor position in GA, which is required to make these changes.
- Go to Configure > Events to start a new event.
- Finally, choose to Create Event.
- If you have more than one property in GA, choose the data stream and
- Tap Create.
- Assign a name to your report. I advise establishing and adhering to a naming standard. For instance, a report utilizing the parameters “audience location, acquisition channel” can be titled “US visitors from social” or something like that. Developing a naming system that you stick to will keep you organized.
- Enter the current Event on which this will be based in the “Matching Conditions” column, such as “click.”
- Choose “copy parameters from the source event” if you wish to use the same parameters as the original Event. Check this option, for instance, if you want your new Event to be triggered whenever a click happens and already have an event for that.
- Indicate any modifications you would like to make to the new Event. You would add it here, for instance, if you wanted to keep track of when someone clicked and subsequently did something else.

5.6. View Suggested Audiences
New audiences are now suggested by Google Analytics 4. This information might be extremely important if you’re trying to grow your user base or enter new markets.
You will provide Google with information about your company, including your industry category, when you build a GA4 property.
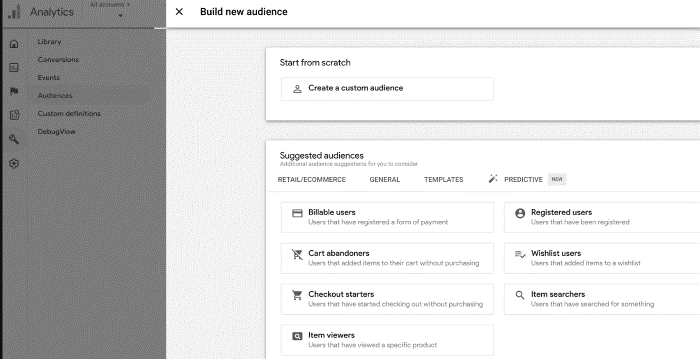
Google makes use of the data to create new audiences that could be suitable for your company. Go to the Audiences section of the Library to access this information. Under Build a New Audience, you’ll see a list of potential audiences.
6. How Does GA4 Help With Reporting?
The value of a data-gathering strategy depends on the information it can produce. Then how would adopting GA4 improve reporting?
It’s becoming more difficult to track customers when they switch between various platforms and devices due to user privacy struggles.
GA4 is a cutting-edge solution that uses improved machine learning methods to close the gap left by the absence of data establishing a single user experience for all data associated with a single identity.
Finally, by simplifying the reporting interface, GA4 made it much easier for marketers to spot critical trends and data anomalies.
In summary cards, GA4 employs overview reports rather than a huge number of preconfigured reports that attempt to cover every use case. Click the scorecard if you want to learn more about anything in depth.
7. Best Practices For Using Google Analytics 4 Reports
The recommended practices for using GA4 reports are covered in this last portion of getting to know Google Analytics 4.
When you initially log in, you’ll see that the main page provides an overview of the property’s general traffic, conversions, and income. Using this as a fast check is advisable to ensure everything is functioning.
Your home page report’s rapid response will be:
- What is the origin of new users?
- Which of your campaigns performed the best?
- Which screens and pages receive the most traffic?
7.1. Realtime Report
The next default report on the left menu is the “Realtime Report,” which displays occurrences from the last 30 minutes.
The Realtime Report may be used to quickly:
- Verify the tracking code is operational.
- YouTube Video Effects to View.
- Watch the New Product Drop live as it occurs.
7.2. The “View User Snapshot” feature is cool.
To view a literal snapshot for a single person, click View user snapshot in the top right corner of the Realtime report.
This contains details about the user’s computer, where they are, and how they interact with the website or app in the present through events.

7.3. Life Cycle Reporting
Life cycle reporting mirrors the funnel of recruiting, engaging, monetizing, and keeping users. It’s perfect for examining how people join the conversion funnel and their actions while there.
Life Cycle Reports can immediately respond to the following:
- In what way do users enter the conversion funnel?
- When consumers are within the funnel, how do they act?
GA4 includes user reports on demographics, technology, occasions, and conversions.

7.4. Explorer Reports: Analysis
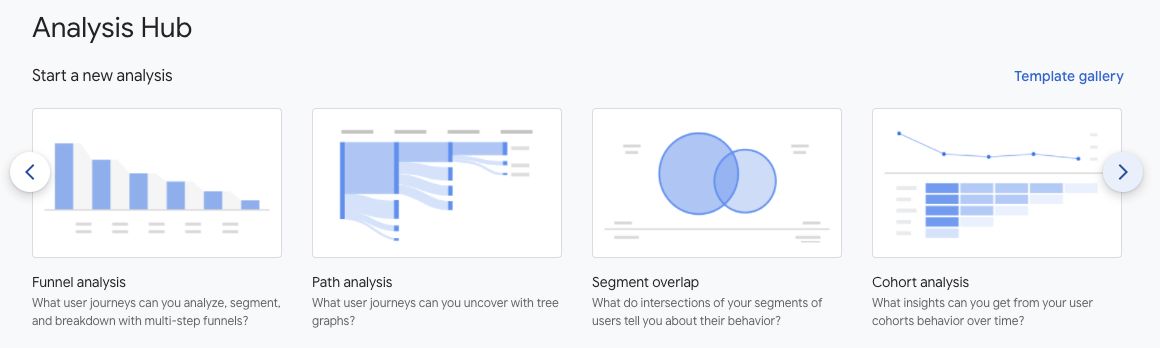
The biggest change in GA4 may be the new Analysis Hub (or at least what I believe will be most helpful for marketers).
While the GA4 Analysis Hub offers you access to various sophisticated approaches and a template gallery that isn’t accessible anywhere else, the basic reports assist you in keeping track of important business indicators.
Creating A New Analysis
- Enter your Google Analytics login information.
- Analyze by clicking.
- Magnifying glass symbol on the graph in the Explore section at the bottom left.
- Select the technique you’ll use to analyze your data.
8. How To Interpret Analysis Hub Reports:
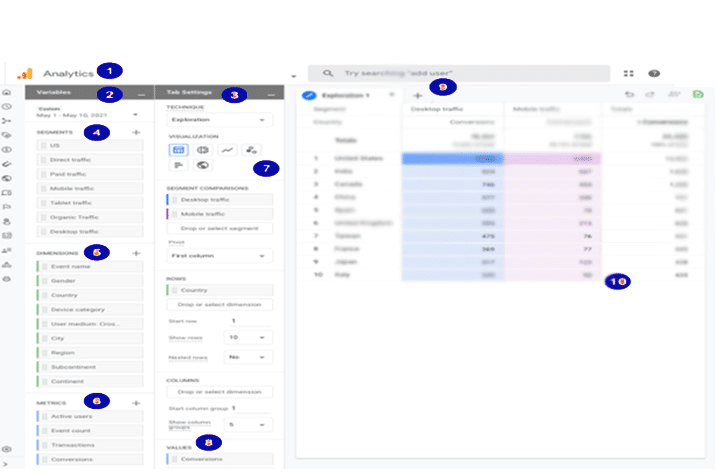
- Visit the Analysis Hub once again.
- Variables Column: You will choose the data for your analysis—date range, intervals, measurements, and metrics.
- Tab Settings Column: In the tab settings column, you may add dimensions, metrics, and segments, as well as select the analysis approach.
- Segments: Different user groups comprise segments. Drag and drop them into your report to compare and contrast how various user groups behave. If the part you want to utilize is missing, you may create your own by selecting the + symbol.
- Dimensions: Dimensions are the items you wish to examine. Examples include the number of events, active users, purchases, etc. Drag and drop dimensions as rows or columns in the Tab Settings box.
- Metrics: Metrics give your analysis of its figures. Values section in Tab Settings, add metrics there.
- Visualization: Decide how you want the report to appear. Table, pie chart, line graph, and more exploration choices are available.
- Values: Drag the metrics you wish the report displays in columns. Cell type can be shown as a heat map, a bar chart, or simple text.
- Tabs: Your visualizations are shown in tabs. Up to 10 tabs can be present in an analysis. Click the + sign to add a new tab.
- Display: You may interact with the data by right-clicking a visualization’s data point.
9. Types Of Analysis
9.1. Exploration
Compared to Universal Analytics, GA4 Exploration offers more customization over the data display.
Exploration has many configurable choices to help you find fresh insights and show your data in a way that is understandable to your team or customer.
Anomaly detection automatically identifies any data points that differ from the predicted result, which is one of my favorite exploring features.
9.2. Funnel Analysis
How do website visits convert to one-time buyers, and how do one-time buyers convert to repeat buyers?
Read the GA4 funnel analysis report to find out. Here, you can observe how well customers are doing as they proceed through an event and how well they are doing or failing at each phase.
9.3. Path Analysis
The analysis hub pathing reports in GA4 are fantastic if you enjoyed the behavior flow reports in universal analytics.
The event stream is shown visually using path analysis as a “tree graph.” The series of actions users took along their route is referred to as an event stream.
The looping behavior that may suggest customers are trapped is discovered by marketers using the route analysis approach.
9.4. Overlapping Segments
Both Universal Analytics and Google Analytics 4 properties support the usage of segments.
Segments in GA4 can be utilized for user sessions or events. Marketers may create segments with several criteria and join those segments together to form a “condition group.”
Consider a segment as a particular subset of your website’s visitors. Those from a given city, those who viewed a particular page, or users who carried out a specific activity, such as purchasing a specific product category, are a few examples of segments.
9.5. Cohort Analysis
A cohort is a collection of users who share some attribute, such as a common acquisition date, experience, or conversion.
For instance, you might develop a cohort report to determine how long it takes for consumers to convert concerning a certain marketing strategy.
9.6. User Lifetime
Because you can generate statistics that show which source is generating customers with the highest lifetime revenue rather than simply income for a certain month, the user lifetime report is incredibly helpful for search marketers.
With GA4, you can identify the marketing efforts that bring in the most valuable customers and have the lowest churn rates.
This has been made possible by Google Analytics’ prediction models.
Conclusion
Google Analytics 4 software could be one of your most successful marketing tools. It makes it easier to understand website traffic and user activity there.
Luckily, creating a GA4 property on your website or application is simple. There is no need to put off the changeover because the procedures described above should take less than 10 minutes to complete.
Better analytics insights lead to more effective marketing decisions.
The analytics upgrade we all required is GA4. It offers more freedom to marketers and a mechanism to predict user behavior while protecting user privacy.
After you overcome the learning curve, you’ll discover that GA4’s versatility and improved insights are well worth the effort.